March 30, 2008

Lab 7: Rectangles, Popups, and Links to the Outside World


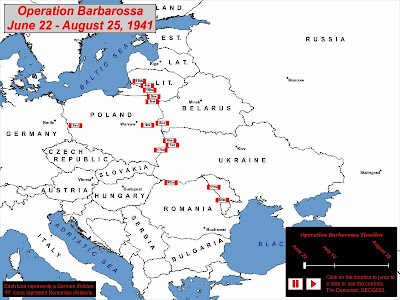
Ok, serious this time. I redid the shape tween because I just had way too many points to keep them from overlapping during the shape tweening, so the shape doesn't look as good as it did before but the shape tweening is better now. I added two popup windows to the bottom, one for project info and one for invasion info. I also added three links to the right side of the screen with more info.

March 26, 2008

Lab 6: The Invasion of Russia by Little Rectangles and a Blob


This week's lab follows on last week's lab, as we added a shape change showing the progression of the Nazis across eastern Europe. The morph works pretty well except for one part in the south where the morph is just a little too complicated for the software. Sadly, I didn't have to time to correct it completely before class, but the lesson here is to keep shapes as simple as possible for morphing in Flash. Otherwise, the map works well.

March 13, 2008

Lab 5: The Invasion of Russia by Little Rectangles


Lab 5 is an exercise in Flash animation. The subject is Operation Barbarossa (sadly, not Operation Barbaro.) It involved motion guides, motion tweens, and lots of graphics. It was a little tricky to figure out how to do the motion guides at first, but once I had it figured out, I finished them pretty quickly. The buttons weren't too hard, either, just a bit time-consuming. The only flaw with the buttons right now is that the vertical lines on the timeline are supposed to cause the timeline to jump, but only the rightmost one works reliably (the middle one is flaky, and the left one works not at all.) I can't really say why that is, but the dates themselves can be clicked on, so I'm not that upset.

March 5, 2008

Map of Considerable Interest #6


(Source:http://dcbid.cartifactmaps.com/)

This week's map is an interactive of downtown Los Angeles. The map allows the user to pan around the downtown area and has labels for most of the important buildings. It primarily concerns residential properties, and most residential properties can be clicked on to bring up detailed information about the property on the left side.

The information includes a street-level photograph of the property, its nearest intersection, the leasing and sales information, and the number of units it contains. Also included are the highest and lowest rental prices on the property and a brief description of it. The map is attractive and easy to understand, and it serves a useful purpose in allowing housing hunters to scan this portion of Los Angeles quickly and learn more about any intriguing areas.

March 1, 2008

Lab 4: Democratic President Election Performance: 1976-2004


Lab 4 is a map of the performance of the Democratic presidential candidates in elections from 1976-2004. Each year is its own layer in the map that can be turned on or off, and each layer is highly transparent. In this way, the user can turn on many years at once and see how Democratic a given state was through the selected years.